


9 CHARTS
Cyber Crime
Intelligence Analysis
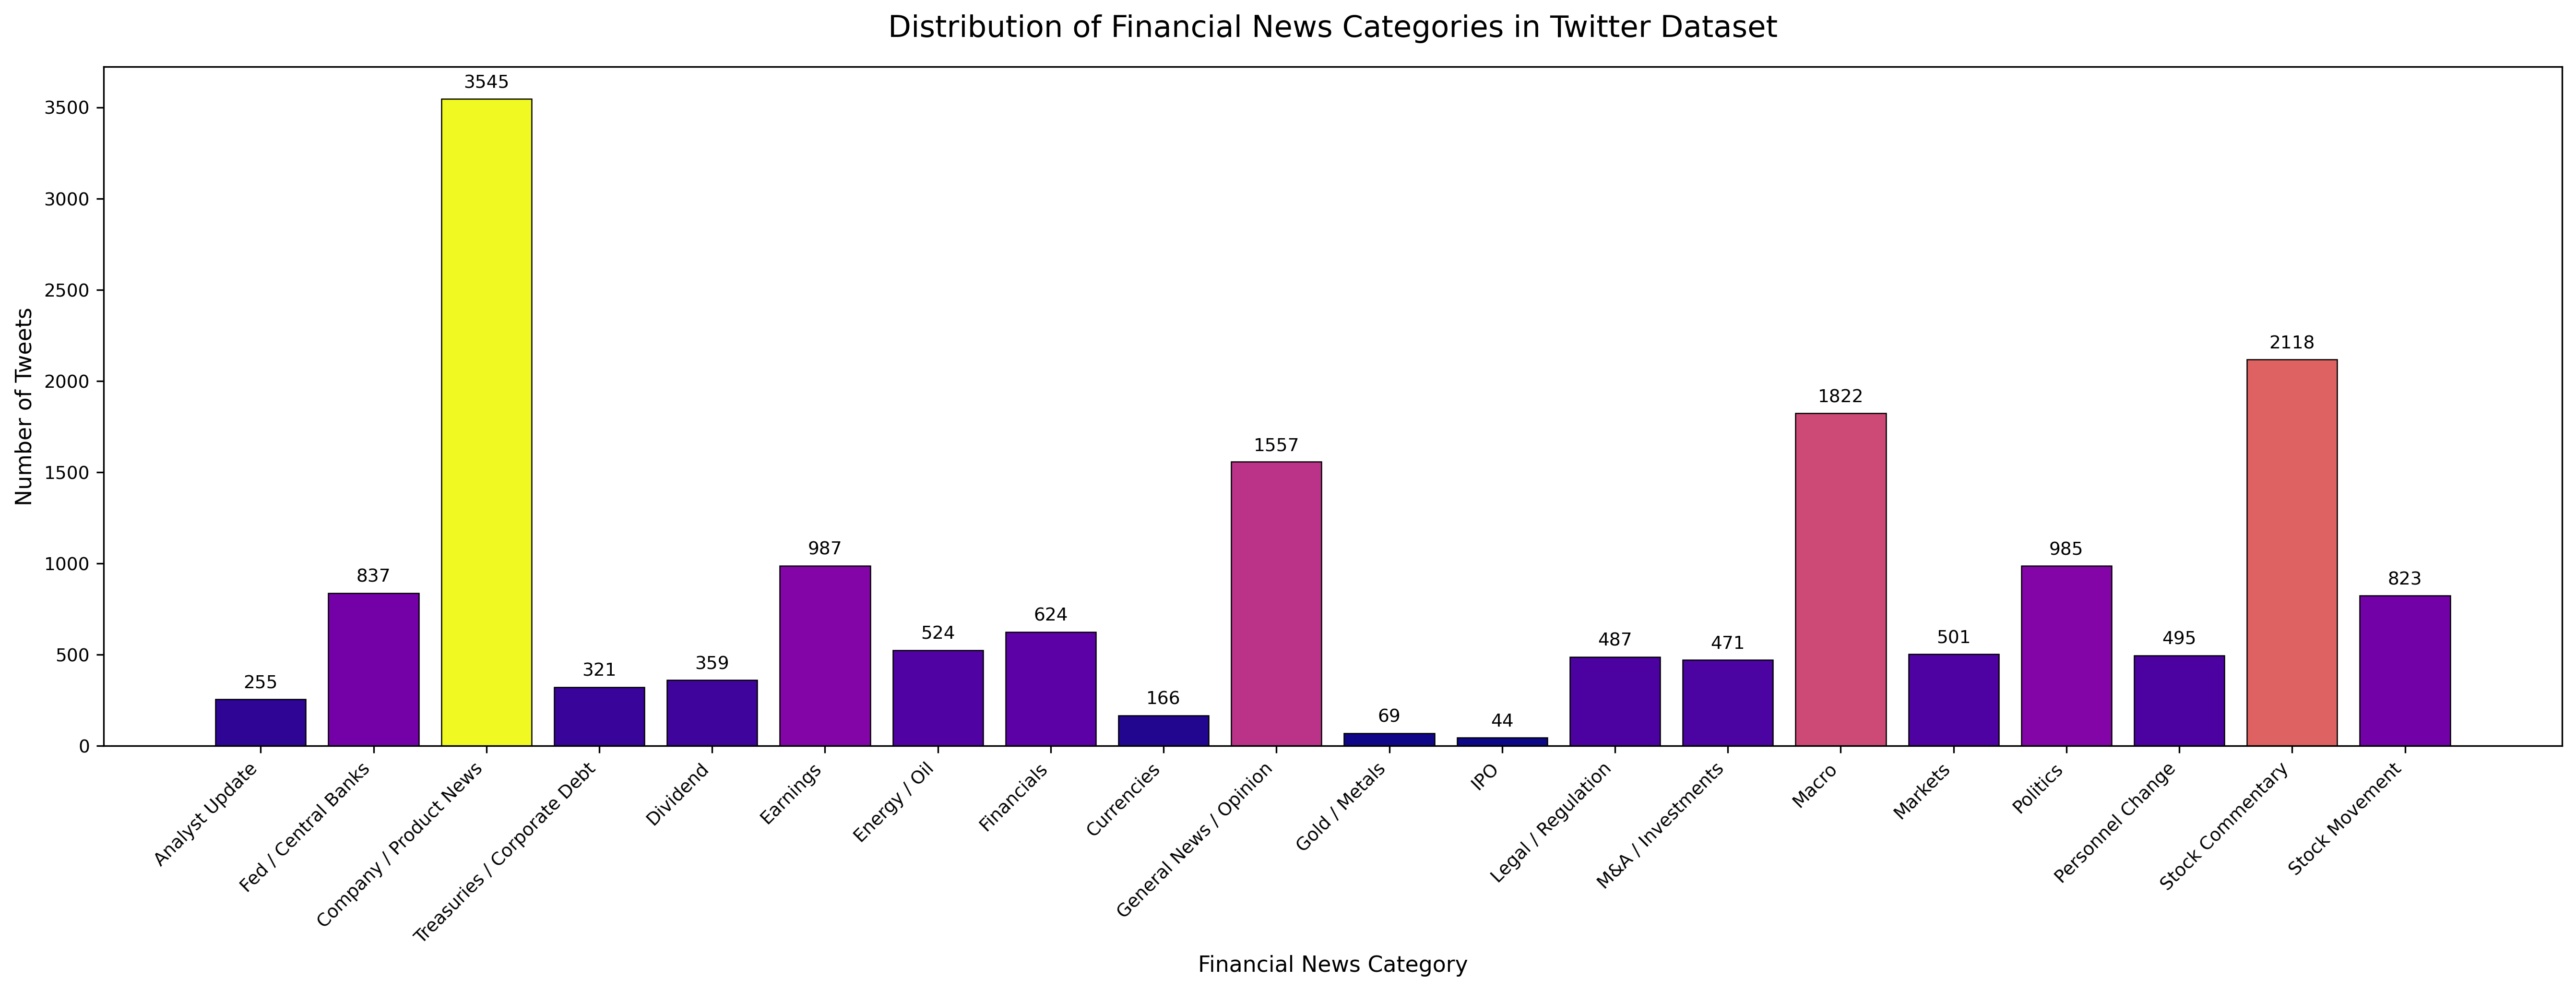
Analytical examination of 20,000 cybercrime complaint records from the Kolhapur District Police Cyber Crime Cell. The study maps complaint growth trends, identifies high-frequency crime categories, and evaluates case resolution patterns across 30+ police divisions over a six-year period (2019–2025).
20,000
COMPLAINTS
327×
GROWTH
80.6%
FIN. FRAUD
Online financial fraud accounts for 80.6% of all reported cybercrime
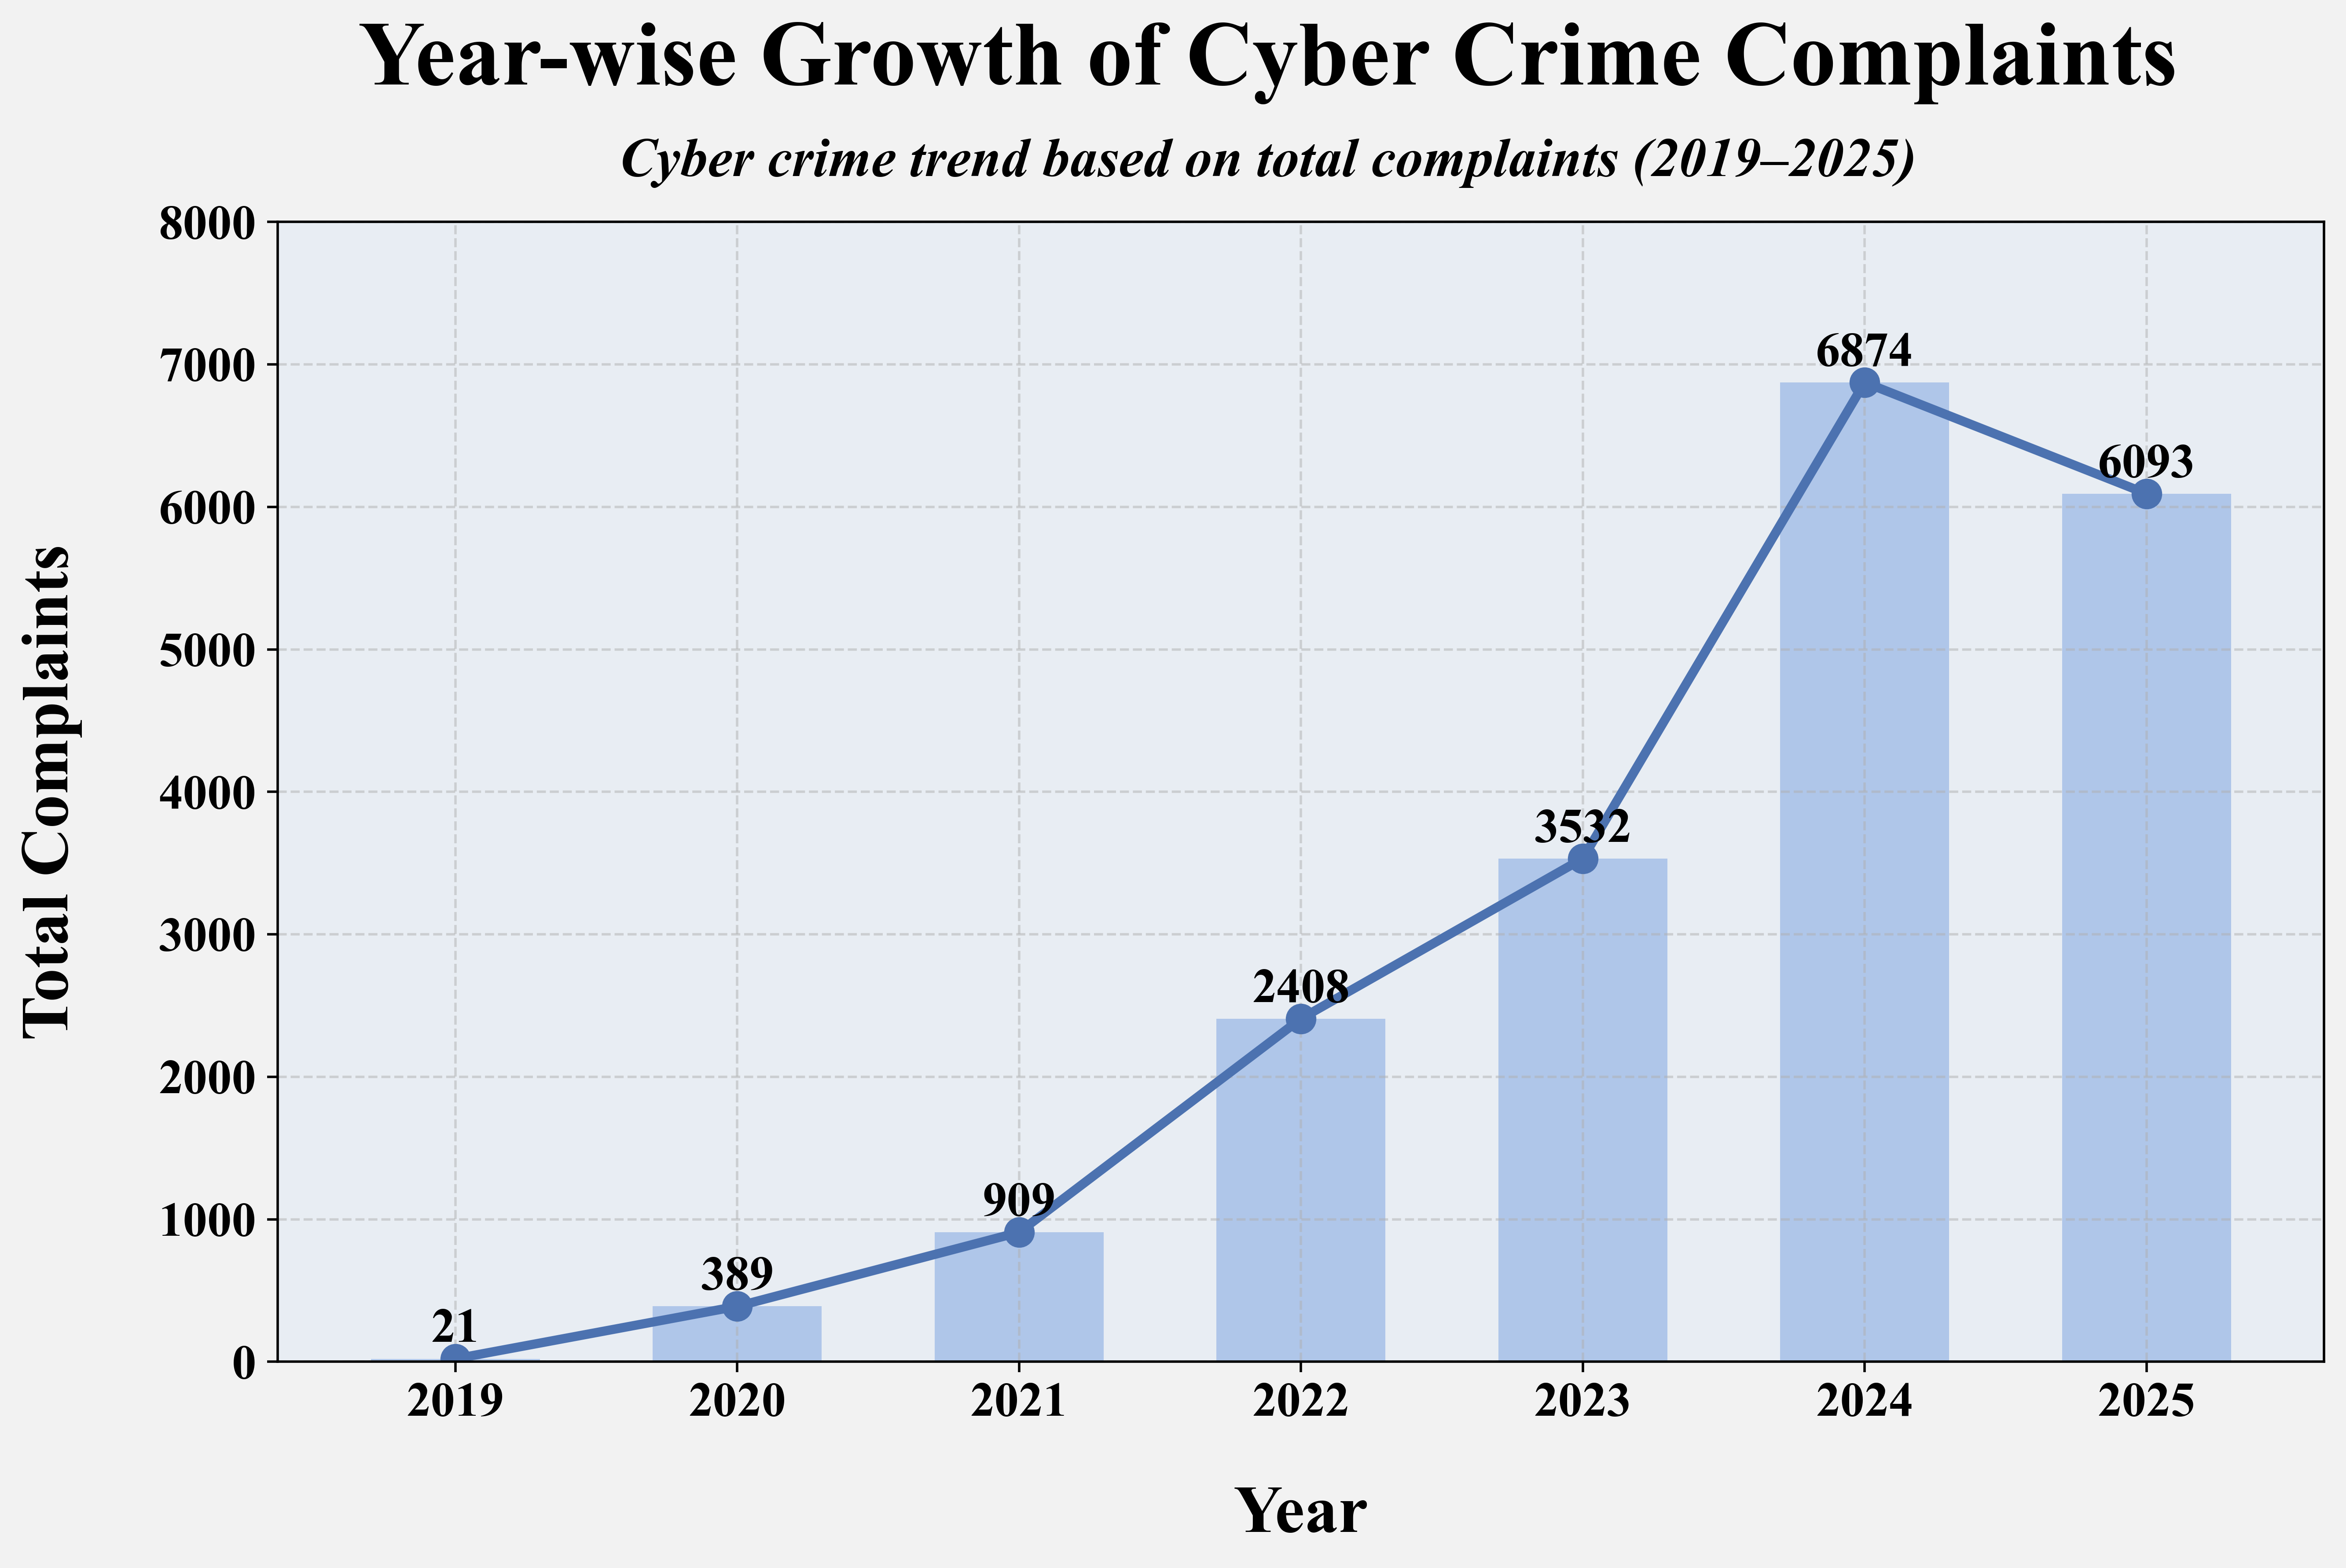
327× complaint growth from 2019 (21) to 2024 (6,874)
30+ police divisions mapped via geospatial analysis
Resolution rate declining as complaint volume scales
Python
Pandas
Seaborn
Matplotlib
Geospatial Analysis
Excel
Statistical Analysis
Due to institutional confidentiality requirements, selected operational datasets and dashboard layers have been anonymized. Selected anonymized layers available on professional request.
Kolhapur District Police